Code Coverage Support According to ISO 26262
Software quality assurance in electronic control devices, according to the ISO 26262 standard, is often a fairly difficult task in practice. Especially in real-time-critical multi-core systems, typical control-flow-oriented methods, which use compiler supported code instrumentation for coverage measurement, very quickly reach their limitations. The code coverage support implemented in UDE® is a trace-based, non-intrusive method that allows to determine the statement coverage (C0 coverage) and branch coverage (C1 coverage) even with optimized code. The measurement is based on instruction trace data, which were delivered by MCDS, NEXUS, ETM and CoreSight hardware trace channels.
Code Coverage Analysis
UDE® provides different views to enable interpretation of code coverage results.
The Program Window displays per-core statement coverage information as line markers for completely covered, partially covered, and uncovered source lines and instructions.
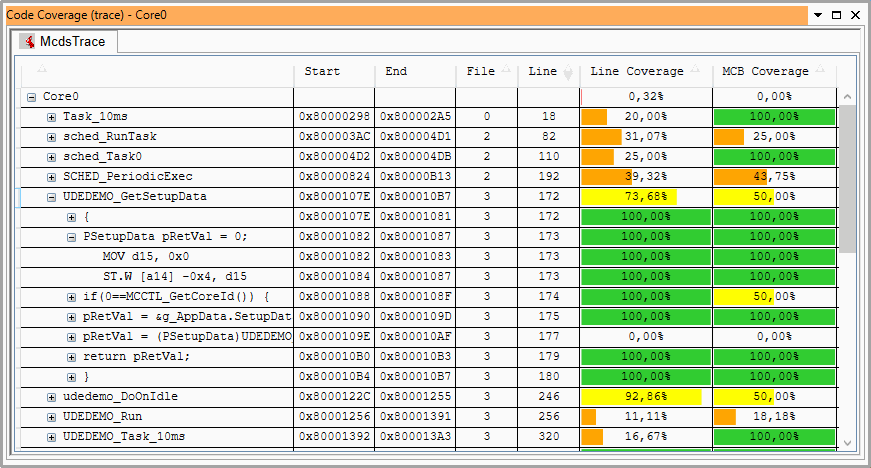
The Code Coverage Window provides details of the coverage on 4 levels:

- core minimum-coverage
- function coverage
- source line coverage
- machine instruction coverage.
Besides the value, the results are displayed as percentage bar chart for C0 and C1 coverage.
Additional functions include
- Sorting of functions by name, start address or coverage value.
- Pre-filtering the trace for analysis of specific functions.
- Object model access for test automation.
- Accumulation of coverage data over multiple trace recordings and sessions.
- Creation of coverage reports in several formats.
Code Coverage Reporting According to ISO 26262 Process
To meet the requirements for evidence of the performed code coverage measurements within the entire software quality assurance process, complete reports with all details have to be created. These reports are essential for the subsequent traceability of the performed measurements and their interpretation.
The UDE® Code Coverage Report contains all information needed to reproduce the coverage results:
- Used target application
- Date of measurement
- Overview about function coverage results
- Line based coverage of source files
- Address based coverage of machine instructions
- List of uncovered instructions and branches.
The reports are previewed in the Code Coverage Window after they are created.
Export Functions
Besides the HTML format, reports can also be generated in XML, CSV and text format. While the XML and text report contains the same information as the HTML report, the CSV report can be configured by the user to provide different levels of details, ranging from function level only to detailed machine instruction level. For multi-session coverage analysis, a storage XML-format is supported, which allows export and import of raw coverage data to/from an external file. It contains all information required to calculate and accumulate coverage data from new trace recordings. Additionally, it provides a history of all trace recordings accumulated in the data.
Efficient Trace Data Collection for Code Coverage
The sophisticated trace configuration management simplifies the collection of trace data for code coverage processing. Based on the Universal Emulation Configurator technology a management front-end enhances the generation of trace configuration, which collects the data of specific code ranges for later proof of code coverage. A special approach helps to analyze the debug information from the program file to reconstruct the program control flow for all supported methods of code coverage analysis. These trace data collection tasks can be used with trace solutions for on-chip trace, external collection of trace data by via Aurora trace interface and up to 4 GB of external trace memory or by execution of test cases via simulator.
Object Model Access
The code coverage analysis is available via the UDE Object Model, as trace stream-based service. The interfaces provide fine grained control over each aspect of the coverage analysis, including configuration, control, access to results and creating of reports. User-controlled or automatic start of analysis or creating of reports and storage exports are provided.
Supported Architectures with UDE® Universal Debug Engine (UDE® Debugger)
- Infineon 32-bit TriCore™ AURIX TC4x Microcontrollers
- Infineon 32-bit TriCore AURIX TC3xx Microcontrollers
- Infineon AURIX TC21, TC22, TC23, TC24, TC26, TC27, TC29, TC2x Microcontrollers
- Infineon TriCore™ AUDO TC1767ED, TC1797ED, TC1798 Microcontrollers
- NXP Power Architecture® MPC57xx Microcontrollers
- NXP Power Architecture® S32R Microcontrollers
- STMicroelectronics Power Architecture® SPC57x Microcontrollers
- STMicroelectronics Power Architecture® SPC58x Microcontrollers
- NXP Power Architecture® MPC56xx Microcontrollers
- STMicroelectronics Power Architecture® SPC56x Microcontrollers
- NXP Cortex®-R52 S32Z and S32E Real-Time Processors
- NXP Cortex-R52 S32S Microcontrollers for Safe Vehicle Dynamics
- STMicroelectronics Cortex-R52, Cortex-M7 Stellar Automotive Microcontrollers
- NXP Cortex®-A53 S32G Vehicle Network Processors
- NXP Cortex-A53 S32V234 Automotive Platform
- Xilinx Cortex-A9 Zynq-7000 Microcontrollers
- Cortex-A8 i.MX51, OMAP35 Microcontrollers
- Texas Instruments Cortex-R4 TMS570 Microcontrollers
- NXP Cortex-M7 Kinetis Microcontrollers
- NXP S32K3 Cortex®-M7 General Purpose Microcontrollers
- Cortex-M4 FM4 Kinetis LPC4000 Microcontrollers
- Cortex-M3 LPC1000 TMS470 TLE9860 Microcontrollers
- STMicroelectronics STM32 Arm Cortex-M Microcontrollers
- Renesas Cortex-M33 RA4 and RA6 Microcontrollers
- Cortex-M0 Kinetis NUC100 Microcontrollers
- Arm7™ Microcontrollers
- Arm9™ Microcontrollers
- NXP S32K1 Cortex®-M Automotive General Purpose Microcontrollers
- NXP S32K5 Cortex®-M7 Cortex®-R52 Automotive Microcontrollers
- Texas Instruments Cortex-R5F TI Sitara AM263Px Microcontrollers
- Infineon TRAVEO™ T2G Arm® Cortex® Microcontrollers
- Infineon XMC1000 Arm® Cortex®-M0 Industrial Microcontrollers
- Infineon XMC4000 Arm® Cortex®-M4 Industrial Microcontrollers
- Infineon XMC7000 Arm® Cortex®-M7 Industrial Microcontrollers
