UDE® Microcontroller Trace Support
Gain Deep Insights into Your Embedded System's Runtime Behavior
Modern microcontrollers and embedded processors are becoming increasingly complex. Multicore architectures, parallel code execution and hard real-time requirements make it difficult to identify timing problems and understand unexpected system behavior using conventional debugging methods.
UDE® provides powerful trace capabilities for non-intrusive debugging and runtime analysis. By capturing execution information without affecting the application's runtime behavior, UDE® gives developers precise insights into what happens inside their embedded systems, including when, where and in which sequence operations are executed.
Combined with powerful visualization and analysis functions, UDE® helps developers identify performance bottlenecks, investigate synchronization problems and optimize complex embedded software.
Comprehensive Trace Visualization and Analysis
UDE® transforms captured trace information into meaningful insights through a range of powerful visualization and analysis tools.
Trace Window – Detailed Insight into Program Execution
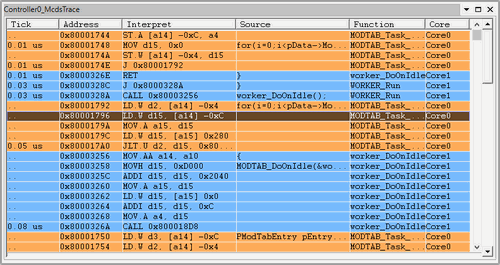
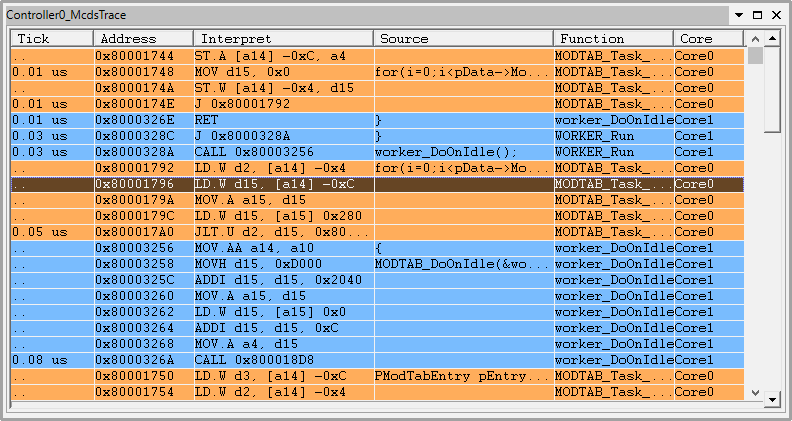
The Trace Window presents captured trace information in tabular form, providing a precise chronological representation of program execution.
Developers can inspect individual trace events, follow the execution flow and navigate directly to the corresponding source code.
Key features:
- Support for different trace sources, including processor cores, buses and peripherals, depending on the target device
- Core-specific coloring and filtering of trace information
- Direct navigation from trace events to source code
- Flexible configuration of displayed trace information
- Fast search across the entire trace recording
Execution Sequence Chart – Visualize Multicore and RTOS Tasks Execution
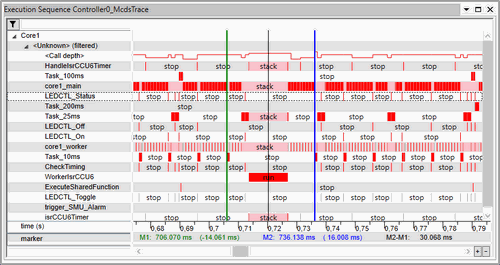
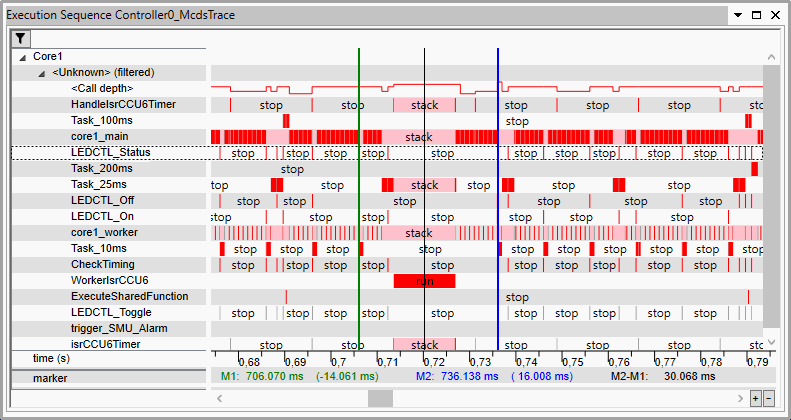
The Execution Sequence Chart provides a graphical representation of the temporal execution sequence of tasks and functions.
Especially in multicore systems, it makes parallel program execution transparent and helps identify timing bottlenecks, synchronization issues and unexpected interactions between software components.
Key features:
- Precise visualization of executed tasks and functions over time
- Visualization of parallel execution across multiple processor cores
- Intuitive navigation and zoom functions
- Measurement of time intervals between user-defined markers
Call Graph Analysis and Profiling – Identify Performance Bottlenecks
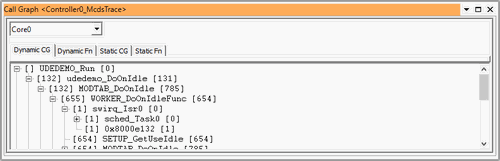
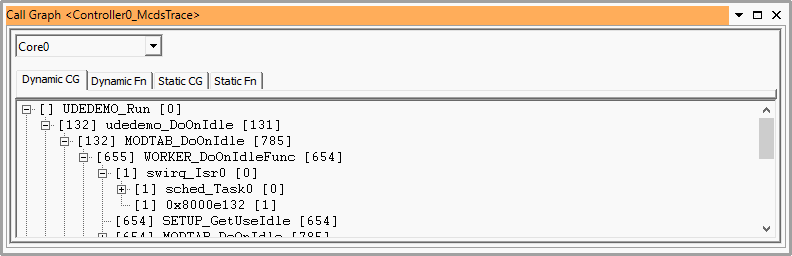
Call Graph Analysis provides insight into the calling relationships between functions and sub-functions.
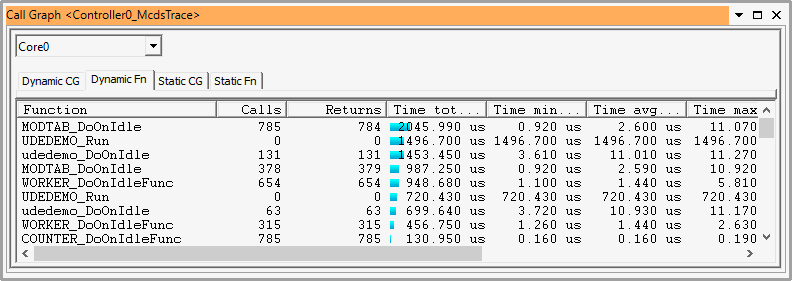
Combined with profiling information, it enables developers to understand the runtime behavior of their software and identify functions that consume significant execution time.
Key features:
- Dynamic call graph showing individual function calls and their calling context
- Static call graph aggregating calls to individual functions
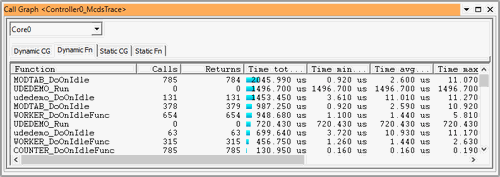
- Runtime statistics for functions and subroutines
- Total, minimum, maximum and average execution times
- Number of function calls and returns
Trace-based Code Coverage – Verify Test Quality
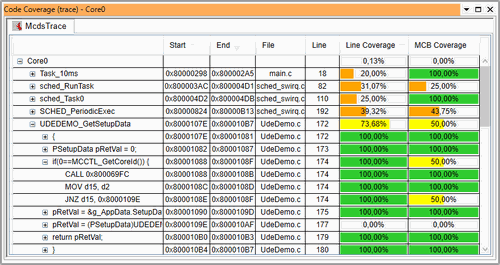
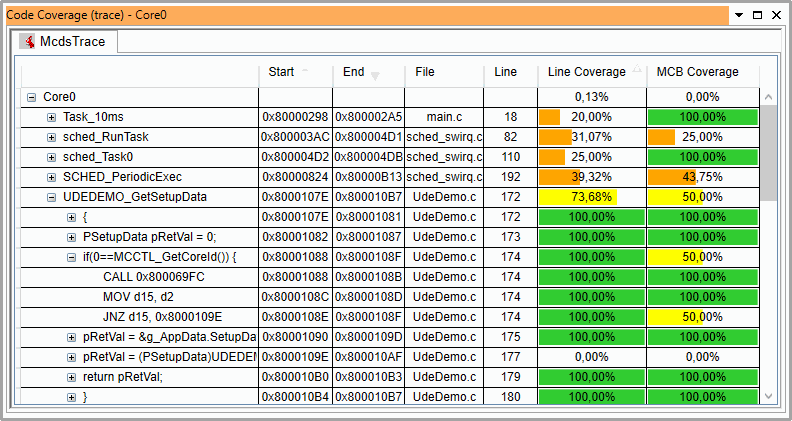
UDE® offers non-intrusive code coverage analysis based on captured trace information.
Statement coverage (C0) and branch coverage (C1) can be determined even for optimized code, without requiring additional code instrumentation.
Key features:
- Non-intrusive code coverage measurement
- Statement coverage (C0) and branch coverage (C1) at object code level
- Support for optimized application code
- Source code highlighting of fully covered, partially covered and uncovered statements
- Dedicated Code Coverage Window with detailed results and graphical statistics
- Extensive report generation
Fast and Reliable Trace Recording for a Wide Range of Architectures
UDE® supports trace recording from a broad range of on-chip trace resources and external trace interfaces. Depending on the target device, trace information from individual processor cores, multicore systems and other system components can be captured and analyzed.
Supported Trace Systems
Capture program execution, data accesses and system events across multiple processor cores. The MCDS provides comprehensive system-level trace capabilities, while miniMCDS offers a more compact trace solution.
Records program flow, data accesses and execution-related events using the standardized IEEE-ISTO 5001 Nexus trace architecture.
Capture program execution and runtime information using the trace capabilities implemented in supported RH850 microcontrollers.
Special debug feature of MIPS' ARC cores. SmaRT Trace captures instruction execution and program flow information and provides insights into the runtime behavior of ARC-based cores.
Supported trace interfaces
High-speed serial interface for transferring large volumes of trace data from the target to an external trace recorder.
Based on the Aurora protocol, the Aurora GigaBit Trace (AGBT) is a high-speed serial interface used in AURIX™ TC2xx/TC3xx emulation devices to transfer captured trace data at a bandwidth of up to 2.5 Gbit/s.
The Serial GigaBit Trace (SGBT) is a high-speed serial interface used in AURIX™ TC4x emulation devices to transfer captured trace data at a bandwidth of up to 6.25 Gbit/s.
Arm® Aurora High Speed Serial Trace Port (HSSTP) is a high-speed serial interface used in selected Arm® Cortex®-R/A devices to transfer captured trace data at a bandwidth of up to 3.125 Gbit/s.
Parallel interface for high-bandwidth transfer of Arm® CoreSight™ trace data.
Parallel interface for transferring trace information based on the IEEE-ISTO 5001 Nexus standard.
Low bandwidth interface for outputting instrumentation trace, software events and diagnostic information.
Powerful Trace Hardware for Demanding Applications
PLS offers high-performance communication hardware for capturing trace information, ranging from integrated debugging and trace solutions to high-end trace recording systems with extensive memory capacity.
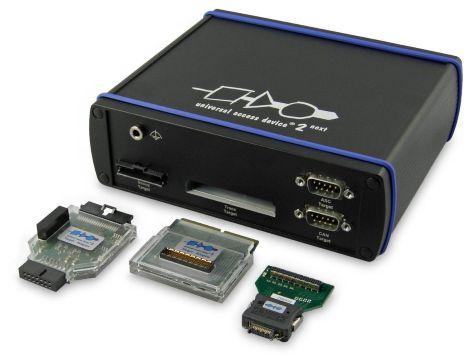
UAD2next
All-rounder Device for Debugging and Trace
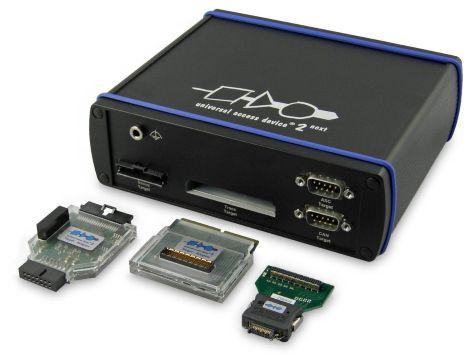
The UAD2next combines powerful debugging capabilities with flexible trace recording. Interchangeable plug-in modules provide support for a wide range of trace interfaces.
Key features:
- Flexible plug-in modules for different trace interfaces
- AURORA serial high-speed trace with data rates up to 1.25 Gbit/s
- Parallel trace with up to 12-bit width at 125 MHz DDR
- Up to 512 Mbytes of trace memory
UAD3+
High-End Trace and Multi-target Debugging
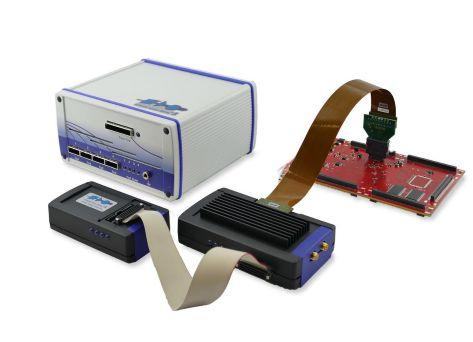
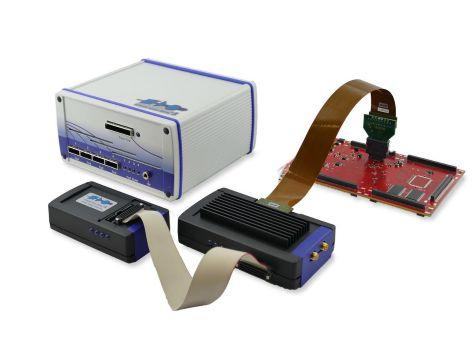
The UAD3+ is designed for demanding trace applications requiring high acquisition bandwidth and extensive trace memory.
A separate Trace Pod connects to the UAD3+ via a high-speed serial multilane cable, allowing flexible positioning of the trace acquisition hardware.
Key features:
- Trace Pod connection via high-speed serial cable, up to 5 meters
- AURORA serial high-speed trace with data rates up to 12.5 Gbit/s
- Parallel trace with up to 20-bit width at 500 MHz
- Up to 8 Gbytes of trace memory