Virtual targets and Simulator Support with UDE® Universal Debug Engine
It is common industry practice to evaluate the functionality and performance of new hardware and software by using development tools to study chip behavior. Typically, these tools will used for testing and debugging code and hardware at various stages in the development cycle.
There are some common problems, which can best solved with a simulator. There are also some jobs, which may be impossible to do without a simulator. Simulators can best used to study a problem in detail by helping to determine what the code was doing at the point of failure. Single stepping through the code essentially performs a dynamic and interactive code walk -through. If the problem can reproduced in the simulator, it can also correct.
A simulator can used effectively in the early stages of software development, reducing the length of time spent later on system integration. Simulator access can also provided to all members of a software team at relatively low cost compared to other instrumentation. Simulation tackles the problems that involve collecting data about the run time behavior of an embedded application. They are also beneficial for creating test conditions that cannot easily duplicated on real hardware. Simulators help get a product to market faster and with fewer defects.
Synopsys Virtualizer Simulator Support
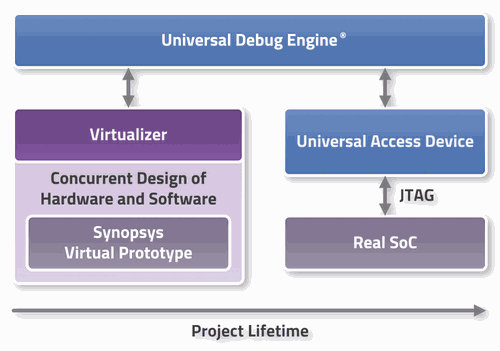
The coupling of the PLS UDE® and Synopsys Virtualizer platforms reduces test times on the real hardware as the joint solution allows more detailed analysis of timing behavior and performance of an embedded application at a very early phase of system design. This prevents downstream errors that cause redesigns and significantly reduces development cost and schedule.
The software architecture of the UDE® Universal Debug Engine guarantees optimal conditions for debugging SoC-based systems. For example, by means of the intelligent use of modern on-chip debugging and on-chip trace units, valuable functions such as profiling and code coverage are available for the system optimization.
The UDE® can establish a connection to Synopsys virtual platforms. The support includes multi-core designs with TriCore, Power Architecture and Arm cores. The solution offers debugging of software at high level language level on the virtual platforms with configuration and control of the processor models.
The simple-to-use modular structure of the UDE® connection to the Synopsys tools is established via a special target interface component. UDE® also offers virtual target configuration, and control of the processor models. Thanks to the modular structure of the UDE® connection to the Synopsys tools, it can be established, via a special target interface component. If the real hardware is available a simple exchange of this component allows a smooth continuation of work.
UDE® Sim
UDE® Sim is a dynamic binary translation (DBT) instruction set (IS) and full system simulator providing high simulation performance.
The purpose of UDE® Sim is to test and debug target software without the need for a real hardware target. The simulation may not only include the instruction set architecture, but may also comprise the IO components available on the target platform. From view of the UDE® user, the simulated target is treated like a regular hardware target platform. All features known within UDE® for the hardware target, such as breakpoints, single stepping, register and memory inspection, are available for the simulated target as well.
TSIM Simulator Support
The TSIM simulator is an instruction model of the TriCore architecture. It can be used to debug programs without having any hardware. The time to finish a new product can be shorter with use of the simulator in early stages of developing.
The TSIM is integrated into Universal Debug Engine via its Generic Debug Instrument (GDI) standard interface. The UDE® wraps its own communication model around this GDI interface.
Some additional configurations can be made to set up the TSIM simulator to your own requirements. The UDE® debugger uses the TSIM interface like a real hardware platform. All ad vantages of HLL-Debugging are offered with the combination of UDE® and TSIM environment.

