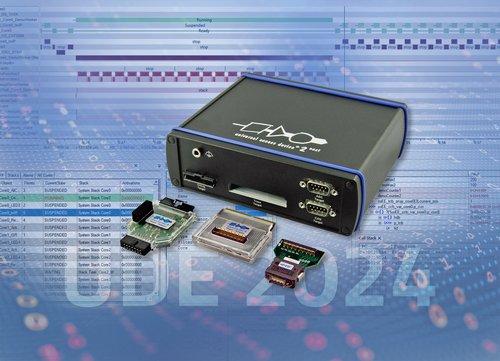
UDE® 2024 scores with even greater ease of use and extended trace support
Press Release
Lauta (Germany), February 7, 2024
Version UDE® 2024 of the Universal Debug Engine from PLS Programmierbare Logik & Systeme offers a wide range of new functions and enhancements that make debugging and runtime analysis of embedded software easier for system developers. In addition to the controllers and architectures already supported by the UDE®, several new MCUs included in the support program also benefit from the additional features that significantly accelerate the development process. PLS will present the first real-life demos of UDE® 2024 at embedded world 2024 in Nuremberg in Hall 4, booth 4-310. The UDE® 2024 is expected to be available in May this year.
As with the previous versions, one of the main focuses in the development of the UDE® 2024 was to make the tool as simple and straightforward to use as possible. Thanks to the intuitive user interface, users of the modular test, analysis and debug tool can get to work on their actual tasks in no time at all without the need for extensive training. Thus, for example, the UDE SimplyTrace® feature provides easy and particularly user-friendly access to the trace functionality of the microcontroller used. The most important components of this feature are convenient and easily accessible commands that can be used to configure the trace system for the respective debugging task in the shortest possible time. Since UDE SimplyTrace® is also integrated into the RTOS Awareness in UDE® 2024, a desired task trace can be generated quickly and efficiently to examine the timing behavior of applications under operating system controllers. Besides real-time operating systems like SAFERTOS, FreeRTOS, PXROS-HR or MicroC/OS-II, AUTOSAR are also supported. In addition, UDE SimplyTrace® can now also be used for those controllers of the Infineon’s AURIX family, which only provide miniMCDS trace. miniMCDS, a more cost-effective trace implementation with a more limited feature set and significantly limited on-chip trace memory, is implemented, for example, in the widely used TC38x device.
Many of the other innovations and enhancements in UDE® 2024 are aimed at making use of specific architecture and device features even more efficient. For example, the MemTool integrated in the UDE® 2024 now also supports the SOTA (Software over the Air) functions of the AURIX TC4x family from Infineon. In addition, the trace functions of the UDE® are also available for the dual MCDS of the TC4x MCUs. They allow the simultaneous recording of traces from all cores. The trace data can be stored either in the internal SRAM of the chip or in the UAD2next and UAD3+ devices from PLS's Universal Access Device family. In the latter case, the trace information is transferred via the high-speed serial SGBT interface. The Parallel Processing Unit (PPU) of the TC4x has also been integrated into the trace support. As an accelerator core for AI algorithms etc., the PPU provides instruction and data trace. Both are displayed in the UDE® Trace Window and provide valuable information for debugging and analysis purposes. Numerous improvements have also been implemented for debugging the SCR stand-by controller from the AURIX family. Among other things, the UDE® 2024 supports the SCR compiler from HighTec.
For non-invasive system and the investigation of errors in the runtime behavior, trace support is now also available for Infineon's TRAVEO T2G and XMC7000 families. The Arm Cortex-based controllers feature the Arm CoreSight debug and trace system, including the Embedded Trace Marcocell (ETM) for instruction trace and the Instrumentation Trace Macrocell (ITM) for instrumentation trace. The recorded trace information can be stored either on-chip in the Embedded Trace Buffer (ETB) or in the UAD2next or UAD3+ of the Universal Access Device family from PLS. The UDE® 2024 provides trace support for the RH850/U2B series from Renesas as well. Again, the recorded trace information can either be stored on-chip and then loaded via the debug interface to the UDE® for further processing, or transferred to the external trace memory of the UAD2next or USD3+. For the latter, a serial AURORA interface is used.
In addition to the standard AURORA Trace Pod, which offers data rate of up to 3.125 Gbit/s, PLS also provides the UAD3+ Serial Trace Pod 100G to meet the requirements of the very high data rates of the trace interfaces found on high-end automotive microcontrollers. The UAD3+ Serial Trace Pod 100G transfers trace data at up to 100 Gbit/s.
A new display option in the trace window of the UDE® 2024 is very helpful when investigating data accesses using traces. In addition to the already supported decimal and hexadecimal representation, floating point numbers can now also be displayed as such, which is a significant simplification for the user. The display of the call stack has also been optimized, especially for Arm-based controllers and RH850 devices. The call stack display is now reliably available at the breakpoint or generally when the application is stopped, even if an interrupt or trap handler is executed.
Especially for the development and testing of automotive applications, UDE® offers debugging via CAN in addition to the standard debug interfaces for accessing to the controllers. This allows debugging even if the debug interfaces of the ECUs are no longer accessible from the outside, for example because the housing is already closed. With the UDE® 2024, this option is now available not only for Infineon’s AURIX MCU family, as previously, but also for STMicroelectronics Stellar MCUs.
The STM32H745, STM32H755, and STM32C011 from STMicroelectronics and the KW45 Bluetooth Long-Range MCU, an Arm® Cortex®-M33-based device from NXP Semiconductors, have been added to the UDE® 2024 portfolio of supported MCUs.

